


Interactive Forex Charts
Deskripsi Interactive Forex Charts
**Announcement: Market Data updated for v.2.56
Forex is an exciting financial instrument that offers active traders with abundant opportunities to profit from regular price movements. Because of its high liquidity and 24 hour trading, it is ideal for active traders to trade frequently by taking advantage of predictable price swings, range bounded movements, trend following, trend reversals and trend exhaustions. Screenulator with its experience stock charting analysis finally brings the powerful AI chart pattern recognition engine, and industry leading interactive charting app to Forex market.
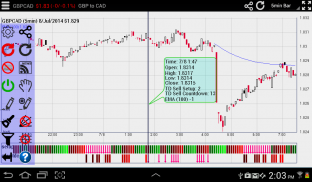
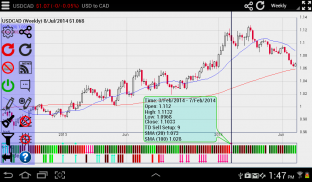
The app is based on Interactive Stock Charts app © with advanced yet intuitive, easy to use touch screen interface allowing you to freely adjust time frame and view technical information with touch of finger: scroll, pan and zoom on a beautiful candlestick charts with gesture and touch control. Swipe to scroll into historical analysis, pinch to zoom and change time frame, touch on price points to show detailed quotes and technical indicator values. Backed by Screenulator's patent pending automated chart pattern and trendline recognition engine, and industry's first Trend Reversal (9,13 count Sequential) pattern screener, and full suite of technical analysis tools, you will have the best analysis tool for Forex trading!
Screenulator.com uses the AI based chart pattern recognition and automated trendline capabilities, as well as state of the art TR/TD short term signals. By using machine Deep Learning Neural Networks algorithms, the selected stocks with desired chart patterns and TR/TD signals are highly reliable and profitable.
About Trend Reversal Indicator:
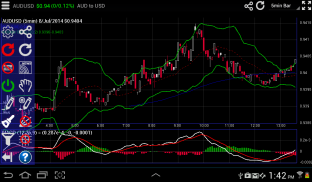
Screenulator's patent pending Trend Reversal and Exhaustion indicators combines 9,13 counting with trendline analysis to pinpoint trend pivots with color coded visual indicator. It has been shown to have an impressive record of identifying and anticipating turning points across the FX, bond, equity and commodity markets. Furthermore, the indicators provide signals not only on a daily chart but also intraday. It identifies when a trend is becoming, or has become, exhausted. This apps automatically identifies Trend Reversal, Trend Exhaustion, and Perfection criteria. It also calculates stoploss levels. To learn more: http://www.screenulator.com/show_video.php?id=TR_EXAMPLES
http://www.screenulator.com/cgi-bin/v?pid=ref#reversal
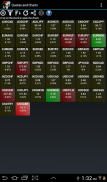
Top 40 Forex pairs are supported for both intraday, daily, weekly time frames. You can pinch zoom to change time frames easily. Touch the price candle to display information.
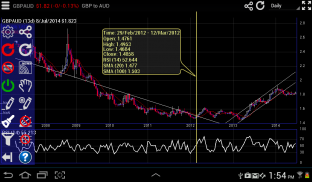
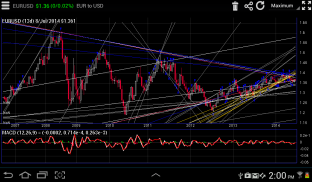
About Trendlines:
A trend line is a bounding line for the price movement of a security. A support trend line (or a bottom line) is formed when a securities price decreases and then rebounds at a pivot point that aligns with at least two previous support pivot points. Trendlines are considered by many expert traders to be the single most important tools in technical analysis. However, Support and Resistance breakout and Triangle patterns are just example of patterns formed by trendlines. This app automatically draws and screens for stocks with specific patterns. To learn more: http://www.screenulator.com/cgi-bin/v?pid=ref#trendlines
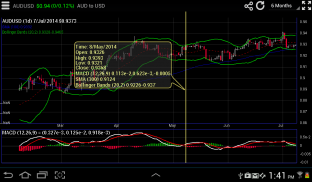
Classic TA indicators and overlays: RSI, MACD, SMA, EMA, Bollinger, Donchian, Ichimoku Cloud, Keltner band, Parabolic SAR, SuperTrend, McGinley Dynamic, stochastic, ADX, Aroon, Chaikin, Ultimate, MFI, OBV, ATR, ADL, CCI indicators. Fibonacci Retracement and text annotation tools. Others will available upon requests.
Supported markets:
EOD and intraday data: NASDAQ, NYSE, AMEX, TSX, HKEX, Australia, India (NSE)
EOD data only: JKSE, Shenzhen, Shanghai, Singapore, UK, Paris, Brussels, Amsterdam, Milan, Athens
FOREX: All Forex currency pairs
** Pengumuman: Data Pasar diperbarui untuk v.2.56
Forex merupakan instrumen keuangan yang menarik yang menawarkan pedagang aktif dengan banyak peluang untuk mendapatkan keuntungan dari pergerakan harga biasa. Karena likuiditas yang tinggi dan perdagangan 24 jam, sangat ideal untuk pedagang aktif diperdagangkan sering dengan mengambil keuntungan dari perubahan harga diprediksi, berbagai gerakan dibatasi, mengikuti tren, pembalikan tren dan exhaustions tren. Screenulator dengan analisis charting pengalaman sahamnya akhirnya membawa mesin kuat AI pola grafik pengakuan, dan industri terkemuka aplikasi charting interaktif untuk pasar Forex.
Aplikasi ini didasarkan pada Interaktif Stock Charts aplikasi © dengan canggih namun intuitif, mudah digunakan antarmuka layar sentuh yang memungkinkan Anda untuk bebas menyesuaikan kerangka waktu dan melihat informasi teknis dengan sentuhan jari: gulir, pan dan zoom pada grafik candlestick yang indah dengan isyarat dan kontrol sentuh. Gesek untuk menggulir ke dalam analisis sejarah, mencubit untuk memperbesar dan mengubah kerangka waktu, menyentuh titik harga untuk menunjukkan kutipan rinci dan nilai-nilai indikator teknis. Didukung oleh paten Screenulator ini tertunda pola otomatis grafik dan mesin pengakuan trendline, dan pertama Trend industri Pembalikan (9,13 count Sequential) screener pola, dan suite lengkap dari alat analisis teknis, Anda akan memiliki alat analisis terbaik untuk perdagangan Forex!
Screenulator.com menggunakan pengakuan berdasarkan AI pola grafik dan kemampuan trendline otomatis, serta keadaan seni TR / TD sinyal jangka pendek. Dengan menggunakan mesin Jauh Belajar Jaringan Syaraf algoritma, saham yang dipilih dengan pola grafik yang diinginkan dan TR / sinyal TD sangat handal dan menguntungkan.
Tentang Trend Indikator Reversal:
paten Screenulator ini tertunda Trend Reversal dan Kelelahan indikator menggabungkan 9,13 menghitung dengan analisis trendline untuk menentukan pivot tren dengan kode warna indikator visual. Telah terbukti memiliki catatan mengesankan mengidentifikasi dan mengantisipasi titik balik di pasar FX, obligasi, ekuitas dan komoditas. Selain itu, indikator memberikan sinyal tidak hanya pada chart daily tetapi juga intraday. Ini mengidentifikasi ketika tren menjadi, atau telah menjadi, habis. Aplikasi ini secara otomatis mengidentifikasi Trend Reversal, Trend Kelelahan, dan kriteria Kesempurnaan. Hal ini juga menghitung tingkat stoploss. Untuk mempelajari lebih lanjut: http://www.screenulator.com/show_video.php?id=TR_EXAMPLES
http://www.screenulator.com/cgi-bin/v?pid=ref#reversal
Top 40 pasang Forex yang didukung untuk kedua intraday, harian, kerangka waktu mingguan. Anda dapat mencubit zoom untuk mengubah frame waktu dengan mudah. Sentuh candle harga untuk menampilkan informasi.
Tentang Trendlines:
Sebuah garis tren adalah garis pembatas untuk pergerakan harga keamanan. Sebuah garis tren support (atau garis bawah) terbentuk ketika penurunan harga surat berharga dan kemudian rebound pada titik poros yang sejalan dengan setidaknya dua sebelumnya poin dukungan pivot. Trendlines dianggap oleh banyak pedagang ahli untuk menjadi alat yang paling penting dalam analisis teknis. Namun, Dukungan dan Resistance breakout dan Segitiga pola hanya contoh pola yang dibentuk oleh trendlines. Aplikasi ini secara otomatis menarik dan layar untuk saham dengan pola tertentu. Untuk mempelajari lebih lanjut: http://www.screenulator.com/cgi-bin/v?pid=ref#trendlines
Klasik TA indikator dan overlay: RSI, MACD, SMA, EMA, Bollinger, Donchian, Ichimoku Cloud, Keltner Band, Parabolic SAR, SuperTrend, McGinley Dinamis, stochastic, ADX, Aroon, Chaikin, Ultimate, LKM, OBV, ATR, ADL, CCI indikator. Fibonacci Retracement dan alat anotasi teks. Orang lain akan tersedia berdasarkan permintaan.
pasar yang didukung:
EOD dan intraday Data: NASDAQ, NYSE, AMEX, TSX, HKEX, Australia, India (NSE)
Data EOD hanya: JKSE, Shenzhen, Shanghai, Singapura, Inggris, Paris, Brussels, Amsterdam, Milan, Athena
FOREX: Semua pasangan mata uang Forex
Interactive Forex Charts - Versi 2.34
(28-05-2020)Interactive Forex Charts - Informasi APK
Versi APK: 2.34Paket: com.screenulator.forexVersi Terakhir dari Interactive Forex Charts
Versi lain


Aplikasi pada kategori yang sama

Anda juga mungkin suka...
Aplikasi pada kategori yang sama


